In this tutorial and the examples going forward we’ll use a project setup which is available at path ‘https://github.com/vinsguru/opentelemetry-observability‘. We are using the ‘02-distributed-tracing‘ section in this tutorial.
We’ll discuss the various files in the repository. Here is the docker-compose.yaml:
services:
  movie-service:
    image: vinsguru/movie-service
    container_name: movie-service
    volumes:
      - ./docker-volume/otel:/otel
    command: >
      java
      -javaagent:/otel/opentelemetry-javaagent.jar
      -Dotel.javaagent.configuration-file=/otel/opentelemetry-config.properties
      -Dotel.service.name=movie-service
      -jar /app/app.jar
    depends_on:
      - otel-collector
    environment:
      "actor-service.url": "http://actor-service:8080/api/actors/"
      "review-service.url": "http://review-service:8080/api/reviews"
    ports:
      - "8080:8080"
  actor-service:
    image: vinsguru/actor-service
    container_name: actor-service
    volumes:
      - ./docker-volume/otel:/otel
    command: >
      java
      -javaagent:/otel/opentelemetry-javaagent.jar
      -Dotel.javaagent.configuration-file=/otel/opentelemetry-config.properties
      -Dotel.service.name=actor-service
      -jar /app/app.jar
    depends_on:
      - otel-collector
  review-service:
    image: vinsguru/review-service
    container_name: review-service
    volumes:
      - ./docker-volume/otel:/otel
    command: >
      java
      -javaagent:/otel/opentelemetry-javaagent.jar
      -Dotel.javaagent.configuration-file=/otel/opentelemetry-config.properties
      -Dotel.service.name=review-service
      -jar /app/app.jar
    depends_on:
      - otel-collector
  otel-collector:
    image: otel/opentelemetry-collector-contrib:0.133.0
    container_name: otel-collector
    command: ["--config=/etc/otel/collector-config.yml"]
    volumes:
      - ./docker-volume/collector-config.yaml:/etc/otel/collector-config.yml
  tempo:
    image: grafana/tempo:2.8.2
    container_name: tempo
    command: ["-config.file=/etc/tempo.yaml"]
    volumes:
      - ./docker-volume/tempo.yaml:/etc/tempo.yaml
    depends_on:
      - otel-collector
  grafana:
    image: grafana/grafana:12.0
    container_name: grafana
    volumes:
      - ./docker-volume/grafana-datasources.yaml:/etc/grafana/provisioning/datasources/datasource.yaml
    ports:
      - "3000:3000"
    environment:
      - GF_SECURITY_ADMIN_USER=admin
      - GF_SECURITY_ADMIN_PASSWORD=admin
    depends_on:
      - tempo
The different services here are:
- movie-service
- actor-service
- review-service
- otel-collector
- tempo
- grafana
Let’s discuss the other config files.
opentelemetry-config.properties
# download java agent: https://opentelemetry.io/docs/zero-code/java/agent/getting-started/

otel.service.name=my-service-we-override-via-command-line-options
otel.traces.exporter=otlp
otel.metrics.exporter=none
otel.logs.exporter=none
otel.exporter.otlp.protocol=grpc
otel.exporter.otlp.endpoint=http://otel-collector:4317
opentelemetry-config.properties is the external contract that defines how your Java services produce and export observability data, without requiring any observability-specific code changes inside the services themselves.
Because of this file, the OpenTelemetry agent knows exactly how to participate in your observability architecture: it instruments the code, exports the data to the collector, the collector forwards it to Tempo, and Grafana finally visualizes it.
If any of these values are wrong, the application will still run, but the observability pipeline will silently break, which is why understanding this file is so important.
What this file is and why it exists
- This file is the runtime configuration of the OpenTelemetry Java agent, and it plays the same role for observability that
application.propertiesplays for a Spring Boot application.
When your JVM starts with the-javaagentoption, the OpenTelemetry agent is loaded before your application code, and it reads this file to decide what it should instrument, what kind of telemetry it should produce, and where that telemetry should be sent. Because this configuration is external to the application, the same Docker image can be used in many environments, and only this file needs to change, which is a very important production-grade design principle. - Without this file, the agent would either use defaults that do not match your setup or would not export anything useful at all.
In practical terms, that means your application would still run perfectly, but you would open Grafana and see no traces, which is often confusing for people who are new to observability.
How this file is wired into your Docker setup
- This file is mounted from your host machine into the container and then explicitly passed to the JVM using
-Dotel.javaagent.configuration-file=....
The volume mapping./docker-volume/otel:/otelmakes the file available inside the container, and the JVM option tells the agent exactly where to read it from. This design allows you to change observability behavior without rebuilding the image, which is exactly how real systems are operated.
Controlling what is exported
otel.traces.exporter=otlptells the agent to export traces using the OpenTelemetry Protocol, which is the standard format understood by the OpenTelemetry Collector.
This is the backbone of your whole pipeline, because without a trace exporter, nothing would ever leave the JVM.otel.metrics.exporter=noneandotel.logs.exporter=noneexplicitly disable metrics and logs export, which keeps the demo focused only on distributed tracing and avoids unnecessary complexity.
In real systems you might enable these as well, but for learning purposes it is much easier to reason about one signal at a time.
Controlling where and how the data is sent
otel.exporter.otlp.endpoint=http://otel-collector:4318defines the network location of the OpenTelemetry Collector, and the hostname works because Docker Compose automatically provides DNS for service names.
This means every container can reach the collector simply by using the service name, without hardcoding IP addresses.otel.exporter.otlp.protocol=http/protobufchooses the HTTP-based OTLP transport, which is simple to debug and works well in local and containerized environments.
The protocol choice may look like a small detail, but it must match what the collector is configured to receive.
Controlling how much data is collected (sampling)
otel.traces.sampler=parentbased_always_onmeans that every request will be traced, while still respecting any upstream sampling decision if one exists.
This is perfect for demos and learning, because you never wonder why a particular request is missing from Grafana, although in production you would almost certainly use a more conservative sampling strategy to control cost and overhead.
Adding metadata to every trace
otel.resource.attributes=deployment.environment=dockerattaches additional context to every span and trace, which later allows you to filter, group, and analyze data in Grafana based on environment or any other custom attribute you choose to add.
This may seem minor now, but in real systems this kind of metadata becomes critical when you operate multiple environments such as dev, test, and production.
collector-config.yaml
# otel collector configuration example: https://opentelemetry.io/docs/collector/configuration/

receivers:
  otlp:
    protocols:
      grpc:
        endpoint: ":4317"
      http:
        endpoint: ":4318"

exporters:
  otlp/tempo:
    endpoint: "tempo:4317"
    tls:
      insecure: true

service:
  pipelines:
    traces:
      receivers: [otlp]
      exporters: [otlp/tempo]
This YAML file is the runtime configuration of the OpenTelemetry Collector, and it plays the role of a central traffic controller for all telemetry in your system.
Your Java services do not send traces directly to Tempo. Instead, they send everything to the collector, and the collector, based on this file, decides which protocols it should listen on, which kinds of telemetry it should accept, and to which backend systems it should forward that data. This extra hop may look unnecessary at first, but in real architectures it is extremely valuable because it allows you to change backends, add processing steps, or fork data to multiple destinations without touching application code.
This collector-config.yaml file tells the OpenTelemetry Collector which protocols to listen on, and defines a pipeline that takes incoming traces and forwards them to Tempo.
The big conceptual model: Receivers → Pipelines → Exporters
The OpenTelemetry Collector always works with a three-stage mental model: receivers, processors (optional), and exporters, all wired together using pipelines.
In your file, you are using receivers and exporters directly without any processors in between, which means the collector is acting as a simple and efficient relay. Data comes in through a receiver, flows through a pipeline, and goes out through an exporter. Even though processors are not present here, the pipeline concept is still crucial because it makes the configuration explicit and extensible.
The receivers section: where data enters the collector
receivers:
  otlp:
    protocols:
      grpc:
        endpoint: ":4317"
      http:
        endpoint: ":4318"
- This section defines how the collector accepts incoming telemetry, and in this case you are telling it to accept data using the OTLP protocol over both gRPC and HTTP.
The nameotlphere is not magical; it is simply an identifier that you will later reference in the pipeline. Under it, you are enabling two different transport protocols: gRPC on port 4317 and HTTP on port 4318. This dual setup is very common, because some clients prefer gRPC while others, such as your Java agent in this setup, are configured to use HTTP. - The endpoints
:4317and:4318mean “listen on all network interfaces on these ports inside the container.”
When your Java services send traces tohttp://otel-collector:4318, those requests are received by this HTTP receiver and turned into OpenTelemetry internal data structures inside the collector.
The exporters section: where data leaves the collector
exporters:
  otlp/tempo:
    endpoint: "tempo:4317"
    tls:
      insecure: true
- This section defines the destinations to which the collector can send data, and here you are defining a single exporter that sends data to Tempo using the OTLP protocol.
The nameotlp/tempois again just an identifier, but the convention of usingsomething/targetmakes the configuration easier to read and maintain in larger setups. - The endpoint
tempo:4317uses the Docker Compose service nametempo, which Docker automatically resolves to the Tempo container’s IP address inside the Compose network.
This means the collector can reach Tempo without any hardcoded IP addresses, and if the container is recreated with a new IP, everything still works. - The
tls.insecure: truesetting tells the exporter not to require TLS certificates, which is perfectly fine and very common for local, demo, or internal network setups.
In production, you would almost always use proper TLS, but for learning purposes this removes a lot of unnecessary complexity.
The service section: wiring everything together using pipelines
service:
  pipelines:
    traces:
      receivers: [otlp]
      exporters: [otlp/tempo]
- This is the most important part of the file, because this is where you define the actual data flow inside the collector.
You are defining a pipeline namedtraces, which means this pipeline will handle only trace data. Inside that pipeline, you explicitly say: “Accept trace data from theotlpreceiver and send it to theotlp/tempoexporter.” - The names
otlpandotlp/tempoare references to the identifiers you defined earlier in thereceiversandexporterssections.
This wiring makes the configuration very explicit and very flexible. If tomorrow you wanted to send traces to two backends, or add a processor in the middle to filter or transform data, you would only change this file and not touch any application.
How this matches your Java agent configuration
- Your Java agent is configured to send data to
http://otel-collector:4318using OTLP over HTTP, which matches exactly the HTTP receiver you have enabled here.
Once the data reaches the collector, this pipeline takes over and forwards it to Tempo using OTLP over gRPC on port 4317. - This means the collector is acting as a protocol and routing bridge: it accepts OTLP over HTTP from your services and forwards OTLP over gRPC to Tempo.
This kind of decoupling is one of the main reasons the collector exists in the first place.
tempo.yaml
# https://grafana.com/docs/tempo/latest/configuration/#configure-tempo

server:
  http_listen_address: 0.0.0.0
  http_listen_port: 3200

distributor:
  receivers:
    otlp:
      protocols:
        grpc:
          endpoint: "tempo:4317"
        http:
          endpoint: "tempo:4318"

ingester:
  trace_idle_period: 10s
  max_block_bytes: 1048576
  max_block_duration: 5m

compactor:
  compaction:
    block_retention: 1h

storage:
  trace:
    backend: local
    local:
      path: /tmp/tempo/traces
    wal:
      path: /tmp/tempo/wal
This YAML file is the runtime configuration of Grafana Tempo, and it controls how Tempo receives traces, how it temporarily buffers them, how it compacts them, and where it finally stores them.
While the OpenTelemetry Collector decides how telemetry is routed, Tempo is the system that actually persists trace data and serves it back to Grafana for querying and visualization. In other words, if the collector is the traffic controller, Tempo is the warehouse and library where all traces are stored and later retrieved from.
The server section: how Tempo exposes its own API
server:
  http_listen_address: 0.0.0.0
  http_listen_port: 3200
- This section configures the internal HTTP server of Tempo, which is used by Grafana and by operators to query and manage Tempo.
The address0.0.0.0means that Tempo will listen on all network interfaces inside the container, which is necessary in Docker so that other containers, such as Grafana, can reach it. The port3200is Tempo’s default HTTP API port, and this is the port that Grafana will use (via the datasource configuration) to query traces.
The distributor section: how traces enter Tempo
distributor:
  receivers:
    otlp:
      protocols:
        grpc:
          endpoint: "tempo:4317"
        http:
          endpoint: "tempo:4318"
- The distributor is the entry point of trace data into Tempo, and this section tells Tempo which protocols it should accept for incoming traces.
In your setup, Tempo is configured to accept OTLP traces over both gRPC and HTTP, which mirrors the flexibility you already saw in the OpenTelemetry Collector configuration. - The endpoints
tempo:4317andtempo:4318indicate that Tempo listens for incoming OTLP traffic on these ports within the Docker network.
In practice, your OpenTelemetry Collector sends traces totempo:4317using OTLP over gRPC, and this receiver is what accepts that data and hands it off to the rest of Tempo’s internal pipeline.
The ingester section: how traces are buffered and grouped
ingester:
  trace_idle_period: 10s
  max_block_bytes: 1048576
  max_block_duration: 5m
- The ingester is responsible for temporarily holding incoming spans, grouping them into complete traces, and packaging them into blocks before they are written to storage.
Tempo does not write every single span immediately to disk; instead, it batches spans to improve performance and reduce storage overhead. trace_idle_period: 10smeans that if no new spans arrive for a given trace within 10 seconds, Tempo assumes the trace is complete and finalizes it.
This is a reasonable default for demos and small systems, because it balances responsiveness with completeness.max_block_bytesandmax_block_durationdefine size-based and time-based limits for how large an in-memory block can grow before it is flushed to storage.
These settings prevent unbounded memory usage and ensure that traces are regularly persisted.
The compactor section: how old trace blocks are managed
compactor:
  compaction:
    block_retention: 1h
- The compactor is responsible for managing stored trace blocks over time, including merging and deleting them according to retention rules.
Tempo stores traces in blocks, and without compaction and retention policies, storage would grow indefinitely. block_retention: 1hmeans that trace data will be retained for one hour before being eligible for deletion.
This is intentionally short for a local or demo environment, where long-term retention is unnecessary and disk space should be conserved.
The storage section: where traces are actually stored
storage:
  trace:
    backend: local
    local:
      path: /tmp/tempo/traces
    wal:
      path: /tmp/tempo/wal
- This section defines the storage backend that Tempo uses to persist trace data, and in this setup you are using the simplest possible option: local filesystem storage.
This is ideal for learning and local development, because it requires no external dependencies like object storage. - The
pathunderlocalspecifies where finalized trace blocks are stored on disk inside the container.
Thewal(Write-Ahead Log) path is used to ensure durability, so that traces are not lost if Tempo crashes before flushing in-memory data to permanent storage. - In production systems, this section would typically point to object storage such as S3 or GCS, but the overall structure of the configuration would remain the same.
grafana-datasources.yaml
apiVersion: 1

datasources:
  - name: tempo
    uid: tempo_ds
    type: tempo
    access: proxy
    url: http://tempo:3200
What this file is and why it exists
- This YAML file is a Grafana provisioning configuration that tells Grafana which datasources it should create automatically at startup.
Normally, when you run Grafana, you have to open the UI, go to “Data sources”, click “Add data source”, choose Tempo, and then type the URL manually. This file removes that manual step entirely by describing the datasource declaratively, so Grafana creates it every time it starts, in a fully repeatable and automated way. - Because this file is mounted into the container, Grafana becomes completely self-configuring and ready to use as soon as it starts.
This is extremely important for Docker Compose, CI environments, and production automation, because it guarantees that the UI always comes up in a known, correct state.
The apiVersion line
apiVersion: 1
- This line specifies the version of Grafana’s provisioning file format, not the Grafana server version.
Grafana uses this to understand how to parse and interpret the file, and version1is the current and commonly used format for datasource provisioning. - You can think of this as a schema version for the configuration file itself, which allows Grafana to evolve the format in the future without breaking old files.
The datasources root section
datasources:
  - name: tempo
    uid: tempo_ds
    type: tempo
    access: proxy
    url: http://tempo:3200
- This section is a list of datasources that Grafana should create, and in your case you are defining exactly one datasource: Tempo.
Even though it is only one entry, Grafana treats this as a list, which is why the dash (-) is used.
The name field
name: tempo
- This is the human-readable name of the datasource as it will appear in the Grafana UI.
When you go to “Explore” or when dashboards refer to this datasource, you will see it listed astempo. - This name is purely for display and selection purposes, but it should be stable and meaningful because dashboards and users rely on it.
The uid field
uid: tempo_ds
- This is the unique, internal identifier of the datasource inside Grafana, and it is more important than it looks.
While thenamecan be changed, theuidis what dashboards and links use internally to refer to this datasource in a stable way. - By explicitly setting the UID, you ensure that dashboards will continue to work even if the display name changes, and you also avoid Grafana generating a random UID on each startup.
The type field
type: tempo
- This tells Grafana what kind of datasource this is, and therefore which plugin and query UI it should use.
By settingtype: tempo, you are telling Grafana that this datasource speaks Tempo’s tracing API and should be used for distributed tracing queries. - This is what enables Grafana’s “Trace” and “Explore” views to understand how to query and visualize trace data.
The access field
access: proxy
- This tells Grafana how it should connect to Tempo: through the Grafana backend server rather than directly from the user’s browser.
Inproxymode, the browser talks to Grafana, and Grafana talks to Tempo on the server side. - This is the most common and recommended mode in containerized and production environments, because it avoids browser networking issues, CORS problems, and exposes fewer internal services directly to the user.
The url field
url: http://tempo:3200
- This is the actual network address where Grafana can reach Tempo, and it uses the Docker Compose service name
tempoas the hostname.
Inside the Docker network,tempoautomatically resolves to the Tempo container’s IP address, and port3200is the HTTP port that Tempo exposes for queries. - This matches exactly the
server.http_listen_port: 3200setting you saw in thetempo.yamlfile, which is why Grafana knows where to send its requests.
Start the application
Now, start the application by using docker compose up.
To see the traces login to the Graphana at http://localhost:3000.
Navigate to the ‘Explore’. In the datasources, select ‘Tempo’. It should look similar to the following:
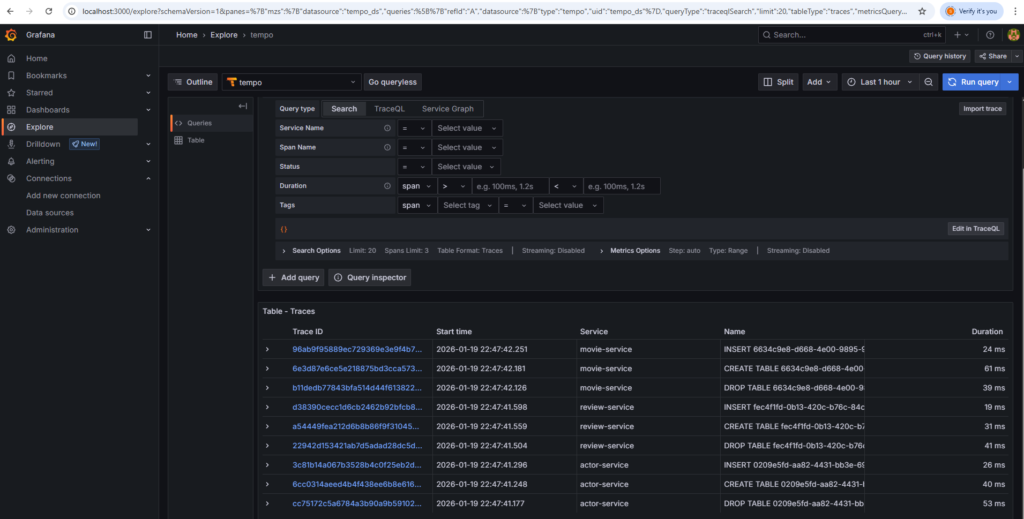
You can click on a particular trace.