1. Introduction
Java Flight Recorder (JFR) is a tool for collecting diagnostic and profiling data about a running Java application. It is embedded within the Java Virtual Machine (JVM) and introduces minimal performance overhead, making it suitable for use in highly demanding production environments. JFR gathers information about both the JVM and the Java application operating on it.
A set of APIs allow JFR to monitor third-party applications, including WebLogic Server. JFR allows you to spend less time diagnosing and troubleshooting issues, lowers operating costs and business interruptions, enables quicker problem resolution, and enhances system efficiency. JFR is a part of JDK distribution.
JFR is related and used with two other tools – Java Mission Control and Diagnostic Command Tools.
2. Uses of JFR
- Profiling – JFR is used to profile applications, allowing developers to analyze the behavior of their code over time. This includes tracking method execution times, identifying hotspots, and understanding execution patterns. JFR saves information about thread samples, lock profiles and garbage collection.
- Black Box analysis: JFR constantly records data to a circular buffer. This data can be retrieved when an anomaly is detected to identify the cause.
- Support and Debugging: Data collected by JFR can be helpful in debugging. JFR helps in monitoring the performance of Java applications by capturing detailed information about the JVM and the application. This includes CPU usage, memory consumption, thread activity, and more. Developers use JFR to diagnose and troubleshoot issues such as application crashes, performance bottlenecks, memory leaks, and deadlocks. The detailed recordings provide insights into the root causes of problems.
- Historical Analysis: JFR allows for the recording and analysis of historical data, enabling developers to understand long-term trends and patterns in application behavior.
3. Events in JFR
Java Flight Recorder collects data about events occurring in the JVM or the Java application at a specific point in time. Each event has a name, a time stamp, and an optional payload. The payload consists of the data linked to an event, such as CPU usage, the Java heap size before and after the event, the thread ID of the lock holder, and similar details. Most events also include details about the thread in which the event took place, the stack trace at the moment of the event, and the event’s duration.
JFR collects information about the following type of events:
- Duration event: Duration event takes some time to occur, and is logged when it completes.
- Instant event: An instant event occurs instantly, and is logged right away.
- Sample event: Sample event is logged at a regular interval and provides a sample of the system activity.
You should limit the number of recorded events as JFR records very high level of details creating enormous amount of data.
- It is possible that there is small delay before data collected by JFR is available to you.
- The data collected in the JFR may not be in sequential order.
You have the option to configure JFR so that it does not write any data to disk. In this mode, the global buffer functions as a circular buffer, discarding the oldest data when it becomes full. In this mode, most recent events are available, usually the last few minutes.
4. Java Flight Recorder Architecture
There are two components of JFR:
- JFR runtime: JFR inside the JVM is responsible for creating the recordings and is called as recording engine. JFR itself is composed of two components:
The agent: The agent manages buffers, disk I/O, MBeans, and other related components.
The producers: The producers populate the buffers with data. They can gather events from the JVM, the Java application, and from third-party applications via a Java API. - Flight Recorder plugin: The Flight Recorder plugin for Java Mission Control (JMC) allows you to interact with JFR directly from the JMC client using a graphical user interface (GUI). It provides capability to start, stop, and configure recordings, in addition to viewing the recording files.
5. Enabling Java Flight Recorder
JFR can be activated in two ways:
- when starting the Java application
- using jcmd tool with diagnostic commands for a running Java application
By default, JFR is disabled in the JVM. Before Java 11, JFR was a commercial feature and avaialable only in the commercial packages based on Java platform, Standard Edition. For such version, JFR has to be enabled using the -XX:+UnlockCommercialFeatures options. To enable JFR, you must launch your Java application with the -XX:+FlightRecorder option.
For example, to enable JFR when launching a Java application named MyApp, use the following command:
java -XX:+UnlockCommercialFeatures -XX:+FlightRecorder MyAppSince Java 11, you may not need to enable using the -XX:+UnlockCommercialFeatures.
Note: If there are multiple versions of Java installed on the machine, ensure that the Java compiler (javac), Java launcher(java) and JFR, JMC and jcmd are used with the same version of Java.
6. Dataflow
JFR saves data about the events in an output file, flight.jfr.
Since writing to a disk is an expensive operation, JFR uses buffers to store the collected data before flushing to the disk. When JFR fails to flush data due to some reason, JFR tries to inform the output file may be missing a piece of data.
7. Example to monitor an application using Java Mission Control
First, configure the JMC to monitor JVM.
- Download the JMC
- Navigate to the JMC executable directory. For example:
C:\softwares\jmc-8.3.1_windows-x64\JDK Mission Control - Start the JMC with the appropriate version of Java, For example:
jmc -vm "C:\Program Files\Java\jdk-19\bin"
Now, let us write a Thread deadlock program and monitor with JMC.
public class TestDeadlockExample1 {
    public static void main(String[] args) {
        final String resource1 = "resource 1";
        final String resource2 = "resource 2";

        // t1 tries to lock resource1 then resource2
        Thread t1 = new Thread() {
            public void run() {
                synchronized (resource1) {
                    System.out.println("Thread 1: locked resource 1");

                    try {
                        Thread.sleep(100);
                    } catch (Exception e) {
                    }

                    synchronized (resource2) {
                        System.out.println("Thread 1: locked resource 2");
                    }
                }
            }
        };

        // t2 tries to lock resource2 then resource1
        Thread t2 = new Thread() {
            public void run() {
                synchronized (resource2) {
                    System.out.println("Thread 2: locked resource 2");

                    try {
                        Thread.sleep(100);
                    } catch (Exception e) {
                    }

                    synchronized (resource1) {
                        System.out.println("Thread 2: locked resource 1");
                    }
                }
            }
        };

        t1.start();
        t2.start();
    }
}
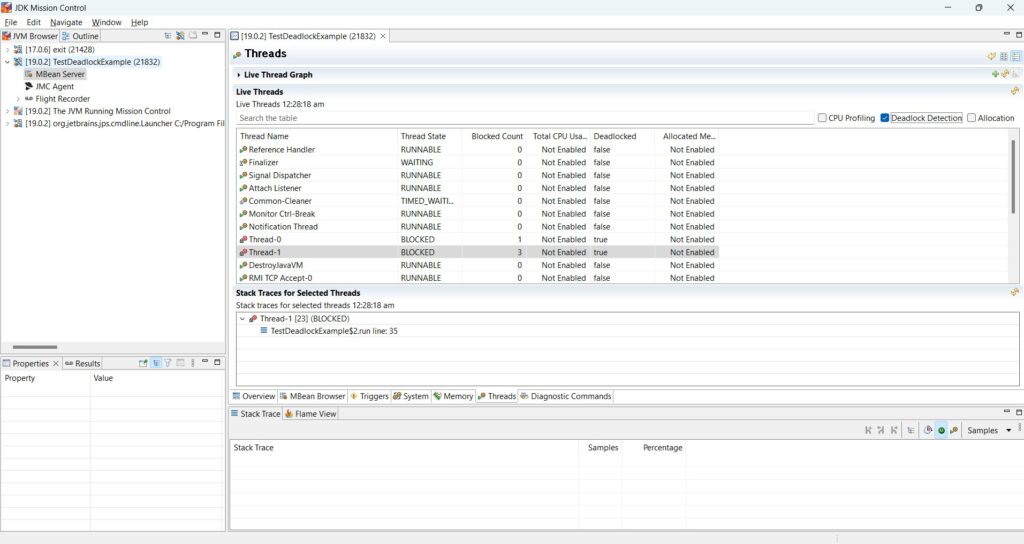
When the program is running, you can observe the application TestDeadlock Example in JVM browser.
As shown here in the image, you can check the threads, Thread-0, Thread-1. If you select the ‘Deadlock Detection’ checkbox, you can notice the state of the threads as BLOCKED and Deadlocked value as true.
8. Reading a jfr file with JMC
Now, let us create a jfr file and read it with the help of JMC.
Run the following command to generate the deadlocked.jfr file.
java -XX:StartFlightRecording=dumponexit=true,filename=deadlocked.jfr TestDeadlockExample.javaIn case of our example, you need to exit the application to generate the file.
You can now open the generated deadlocked.jfr file with JMC.
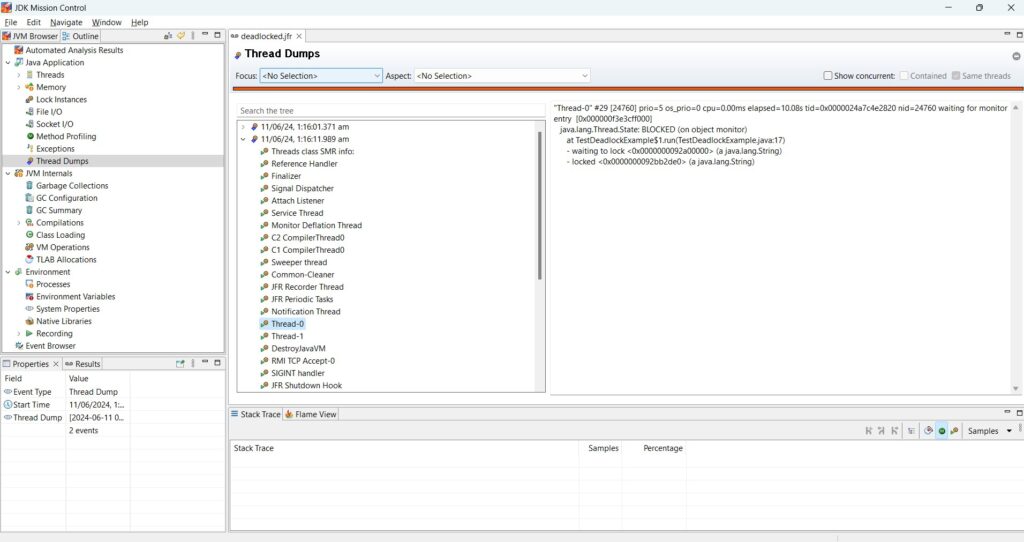
In the ‘Thread Dumps’ section, you can observe that the details of the deadlock can be seen.
9. Conclusion
In conclusion, Java Flight Recorder (JFR) is a powerful tool for monitoring and diagnosing performance issues within Java applications. By enabling detailed recording of system and application behavior, JFR provides valuable insights that help developers and administrators optimize performance, troubleshoot problems, and maintain the health of their systems. Its integration with Java Mission Control (JMC) and user-friendly GUI enhances its usability, making it an indispensable component for effective Java application management and performance tuning.